One of the most valuable alliances between those who make strategy and those who execute it is precisely that between corporate leadership and project managers.
Teams using MAKE PROGRESS® acquire a very special concept, that of the liquid backlog, meaning they are able to frequently prioritize projects based on the impact they are generating.
In fact, project managers look at OKRs the way sailors look at the stars and are incentivized to anticipate or postpone, pieces of the project depending on the results they are delivering.
Indeed, it would be inconvenient to continue working on an outdated roadmap just because that is how it was decided in January! Yet many companies I deal with have this problem.
They invest tens, if not hundreds of thousands, in agile training, implementing time-consuming and expensive ceremonies and a great deal of operational bureaucracy, but their backlog stays current by delivery date. It is no secret that investments on so-called agile transformations often have negative returns.
In today’s note, we will consider one of the simplest official PMI tools and show you how easy it is to integrate it into MAKE PROGRESS®.
It is already available in your OKR Toolkit!
If you purchased it before the release of this guide, you will find the template already updated within Project Alignment.
If, on the other hand, you have not yet had access to this strategy management toolkit, you can do so now. Click here and get access now.
Earned Value Analysis, what is it?
This will probably be the simplest explanation you will find out there. I will avoid overly complicated and technical terms because it is not important here to pass the project manager exam but to have numbers to talk about in the next meeting.
To manage a project well, it takes many techniques to measure progress, evaluate performance, and predict outcomes. Among these techniques, Earned Value Analysis is one of the most effective because it helps project managers better understand the status of their work and make data-driven decisions.
Earned Value Analysis (EVA) is a project management technique that combines timelines and costs to objectively measure project performance and progress.
By comparing the project budget with the cost of the project as it is executed and the actual cost at the end of the project, you can obtain numerical data to evaluate project performance.
This analysis allows project managers to predict the total cost and completion date of the project based on trend analysis or pace of execution.
Key Concepts and Metrics
To use EVA well, project managers need to understand and calculate several key metrics:
Budget at Completion (BAC)
The Budget at Completion (BAC) is the approved budget for the entire project until completely.
For consulting or production companies, it coincides with the client’s approved budget.
Planned Value (PV)
The Planned Value (PV), represents the approved budget up to the day of measurement It indicates how much work should have been completed according to the project plan.
Earned Value (EV)
Earned Value (EV), quantifies the “value” of work completed up to the time of measurement. It represents the expected cost of work actually accomplished (other than planned work), providing a physical measure of progress.
Basically PV indicates how much you planned to spend up to that date, while EV indicates the value (not the cost) of what you actually realized.
Actual Cost (AC)
The Actual Cost (AC), represents the total costs incurred for the work done on the project to date.
Schedule Variance (SV) and Cost Variance (CV)
Schedule Variance (SV) and Cost Variance (CV) indicate whether the project is ahead or behind schedule and whether it is over or under budget. It is calculated as follows:
- SV = EV – PV (program difference)
- CV = EV – AC (cost difference)
Schedule Performance Index (SPI) and Cost Performance Index (CPI)
The Schedule Performance Index (SPI) and Cost Performance Index (CPI) are efficiency ratios that measure project performance and cost, respectively. They provide valuable information about the pace of project consumption and can be used to make forecasts.
- SPI = EV / PV
- CPI = EV / AC
It should read like this: for every euro spent we are getting x of project.
An SPI or CPI value greater than 1 indicates that the project is performing well, while a value less than 1 indicates that you are spending more than planned.
Useful no?
Estimate at Completion (EAC)
The Estimate at Completion (EAC) is the cost projection to complete the project based on how it is going now. It is calculated using various methods; we will use a simplified formula:
- EAC = BAC / CPI
Estimate to Complete (ETC)
The Estimate to Complete (ETC) represents the estimated cost to complete the remaining work. It indicates how much more will have to be spent from the time of measurement to the end of the project, considering current performance conditions.
- ETC = EAC – AC
Variance at Completion (VAC)
The Variance at Completion (VAC) is the difference between the approved budget and the cost projection and indicates whether the project will be completed below or above the approved budget.
- VAC = BAC – EAC
In particular, this indicates whether you will make margin or not.
Analysis and Forecast
This set of metrics is useful for two purposes:
- Analyze the status of the project
- Making predictions
In this table I summarize them and separate them for the two purposes
Analysis
| Budget at Completion (BAC) | Approved budget for the entire project |
| Planned Value (PV) | Approved budget up to the day of measurement |
| Earned Value (EV) | Value of work completed up to the time of measurement |
| Actual Cost (AC) | Total costs incurred for the work done at the time of measurement |
| Cost Variance (CV) | budget difference |
| Schedule Variance (SV) | difference in programming |
| Cost Performance Index (CPI) | project performance |
| Schedule Performance Index (SPI) | economic performance of the project |
Forecasting
| Estimate at Completion (EAC) | Projection of costs to complete the project |
| Estimate to Complete (ETC) | estimated cost to complete the remaining work |
| Variance at Completion (VAC) | indicates whether the project will be completed below or above the approved budget |
Practical Example for a Consulting Firm
This is one of the most classic examples: a consulting firm acquires a new client and offers him an offer that includes an expected margin. But how can one know, week after week, whether the margin will remain so as the work progresses?
With this analysis, it is possible to know with mathematical precision how things are going and avoid nasty surprises.
Project Details:
- Cost of the Project for the Client: €9,000
- Project duration: 12 weeks
- Desired margin: 50%
- Internal Cost (BAC): €4,500
Scenario:
At the end of week 6, the project manager wants to evaluate the performance of the project.
Planned Work:
By the end of week 6, 50 percent of the project should have been completed.
- Planned Value (PV): €4,500 (since 50% of €9,000 is €4,500)
Work Effectively Completed:
They look at their tasks and client feedback and find that the team has completed only 40 percent of the project.
- Earned Value (EV): €3,600 (since 40% of €9,000 is €3,600)
Actual Costs Incurred:
The actual cost incurred by the end of week 6 is €4,800. It contains freelance invoices and the costs of the employees who worked on it.
- Actual Cost (AC): €4,800
EVA analysis:
Cost Variance (CV):
- CV = EV – AC
- HP = €3,600 – €4,800
- HP = -€1,200
- Negative CV indicates that the project is €1,200 over budget.
Schedule Variance (SV):
- SV = EV – PV
- SV = €3,600 – €4,500
- SV = -€900
- Negative SV indicates that the project is overdue by €900 of work, work that will be done later.
Cost Performance Index (CPI):
- CPI = EV / AC
- CPI = €3,600 / €4,800
- CPI = 0.75
- The CPI of 0.75 indicates that for every euro spent, only €0.75 of work was completed.
Schedule Performance Index (SPI):
- SPI = EV / PV
- SPI = €3,600 / €4,500
- SPI = 0.8
- The SPI of 0.8 indicates that the project is progressing at 80% of the planning speed.
Forecast
Estimate at Completion (EAC):
- EAC = BAC / CPI (simplified approach)
- EAC = €4,500 / 0.75
- EAC = €6,000
- The EAC indicates that the total internal cost of the project will eventually be about €6,000 if things do not change.
Estimate to Complete (ETC):
- ETC = EAC – AC
- ETC = €6,000 – €4,800
- ETC = €1,200
- The ETC indicates that an additional €1,200 will be needed to complete the project as of the day of measurement.
Variance at Completion (VAC):
- VAC = BAC – EAC
- VAC = €4,500 – €6,000
- VAC = -€1,500
- The negative VAC indicates that the internal cost of the project will be €1,500 over budget in the end.
Interpretation of Metrics:
Cost Variance (CV) and Cost Performance Index (CPI):
The project is over budget with a CV of -€1,200 and a CPI of 0.75. This suggests that the project is spending more money than planned for the amount of work completed. The project manager needs to investigate the reasons for the cost increase, such as unexpected expenses, rework, errors…, and take corrective action.
Schedule Variance (SV) and Schedule Performance Index (SPI):
The project is behind schedule with an SV of -€900 and an SPI of 0.8. This indicates that the project is not progressing as fast as planned. The project manager should review the activity schedule, identify bottlenecks or delays, and get the project back on track.
Estimate at Completion (EAC) and Estimate to Complete (ETC):
The EAC of €6,000 indicates that if current performance continues, the project will cost €1,500 more than expected. The ETC of €1,200 suggests that the project manager needs to secure additional funds to complete the project or find ways to reduce future costs.
Variance at Completion (VAC):
The negative VAC of -€1,500 highlights a significant over budget. The project manager should discuss this with the client and account and consider possible project adjustments, additional funding, or other strategies.
How is he doing?
Based on this analysis, the consulting project is over budget and behind schedule. The expected margin will no longer be 50% but 33%.
Practical Example for a Retail Company
In this example, we analyze a retail company managing the project of opening a new store. Typically, these projects last for months and require intense investment, with the need to be completed in time to ensure return on investment. In addition, getting to the city before a competitor is critical to the strategy.
Here is how such a project might be managed and analyzed using the metrics just outlined.
Project Details:
- Total Budget (Budget at Completion, BAC): €200,000
- Project duration: 8 months
Scenario:
At the end of month 4, the project manager wants to evaluate the performance of the project.
Planned Work:
By the end of month 4, 50 percent of the project should be completed.
- Planned Value (PV): €100,000 (since 50% of €200,000 is €100,000)
Work Effectively Completed:
The team has completed 60 percent of the project.
- Earned Value (EV): €120,000 (since 60% of €200,000 is €120,000)
Actual Costs Incurred:
The actual cost incurred by the end of month 4 is €130,000.
- Actual Cost (AC): €130,000
EVA analysis:
Cost Variance (CV):
- CV = EV – AC
- HP = €120,000 – €130,000
- HP = -€10,000
- This negative CV indicates that the project is €10,000 over budget.
Schedule Variance (SV):
- SV = EV – PV
- SV = €120,000 – €100,000
- SV = €20,000
- This positive SV indicates that the project is ahead of schedule by €20,000 of work.
Cost Performance Index (CPI):
- CPI = EV / AC
- CPI = €120,000 / €130,000
- CPI = 0.92
- A CPI of 0.92 indicates that for every dollar spent, only €0.92 of work was completed.
Schedule Performance Index (SPI):
- SPI = EV / PV
- SPI = €120,000 / €100,000
- SPI = 1.2
- An SPI of 1.2 indicates that the project is progressing at 120% of the expected speed.
Forecast:
Estimate at Completion (EAC):
- EAC = BAC / CPI (simplified approach)
- EAC = €200,000 / 0.92
- EAC = €217,391
- The EAC indicates that the total cost of the project will eventually be about €217,391 if the current performance trend continues.
Estimate to Complete (ETC):
- ETC = EAC – AC
- ETC = €217,391 – €130,000
- ETC = €87,391
- The ETC indicates that an additional €87,391 will be needed to complete the project as of the day of measurement.
Variance at Completion (VAC):
- VAC = BAC – EAC
- VAC = €200,000 – €217,391
- VAC = -€17,391
- The negative VAC indicates that the project will be €17,391 over budget in the end.
Conclusion:
According to this analysis, the project to set up the new store is over budget but ahead of schedule. The project manager must investigate the causes of the cost overrun and take corrective action, such as cost-saving measures or reevaluate the project plan to avoid further budget problems, or justify the acceleration with the extra budget.
MAKE PROGRESS® and Project Management
At MAKE PROGRESS with OKR, the connection between project management and strategy is crucial. Leaders see the direction of the company, while project managers optimize team resources to execute strategic projects or manage client projects on-time and on-budget.
Without these metrics, every conversation remains vague and meetings risk being based only on opinions.
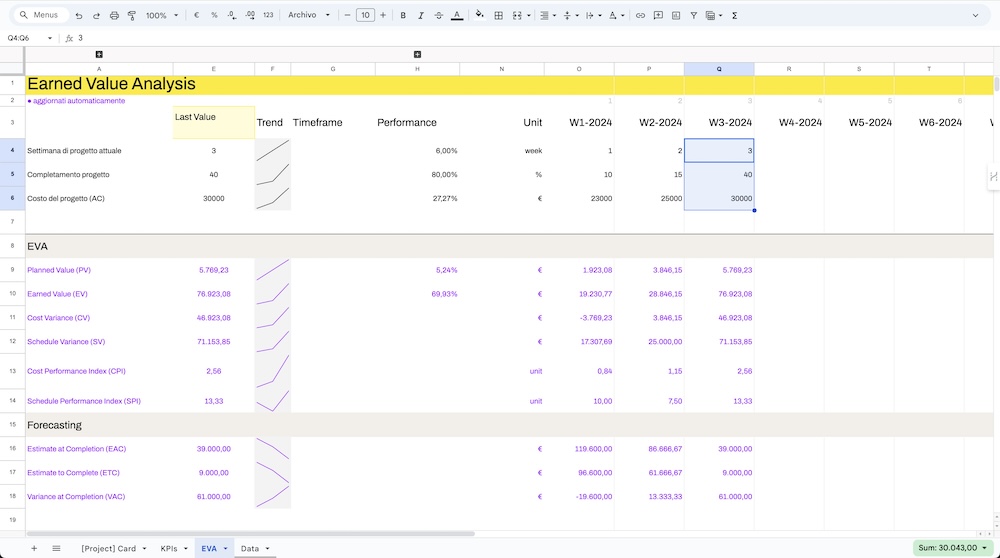
I have shown that this type of analysis is simple: you only need to enter a few numbers. I have updated for you the template with which to do it automatically.
You will find it inside the Project Alignment, the sheet that collects all the company’s projects organized by strategic connection. Each row contains access to the relevant Project Card and key metrics to enter.
Although this guide might seem complicated, EVA analysis takes only about 5 minutes per week to update only 3 essential numbers. The lines in purple indicate that the calculations are automatic. I hope this has been helpful to you.
You can find everything available at this link along with the Big Yellow Book of Strategy.
If you would like to meet with me to understand how to implement these techniques in your team, choose when via this link.