«We acquire companies with the intention of owning and operating them for the long term.»
Luca Ferrari , press release on the agreement for Miro, September 10, 2026 .
●↑
If Bending Spoons acquired another company, the group’s revenue could grow even without improving its product performance. If we looked at that number alone, we might mistake the increase in size for an improvement in the organization.
This is one of the things that happens so often: confusing revenue with growth without considering your strategy. As strange as it may sound, it’s one of the biggest problems for every organization, because the strategy works until it doesn’t work anymore, and no one knows why.
So, what number should we look at to understand whether Ferrari and his team are getting better at managing the companies they acquire?
In a multi-product company, we must distinguish between two types of work: one that improves each product for its customers, and one that improves the organization that manages them all. They cannot be separated, and we need numbers that are useful to both.
This is episode 3 of 6 in the series where I reconstruct the Bending Spoons strategy using MAKE PROGRESS®. In each episode, we fill out a block of the Strategy Focus One-pager (SFO) , the page where we collect the key strategic decisions, so you can apply the same reasoning to your company.
Series Index
- The operating model : what kind of company are we building?
- The Destination : How to Connect Values, Vision, and Mission.
- Metrics: How to Choose the North Star. ← You are here.
- The Growth Machine: What effects make growth repeatable?
- The enablers: what capabilities are needed to execute the strategy.
- Priorities: what to focus your work on.
From destination to numbers
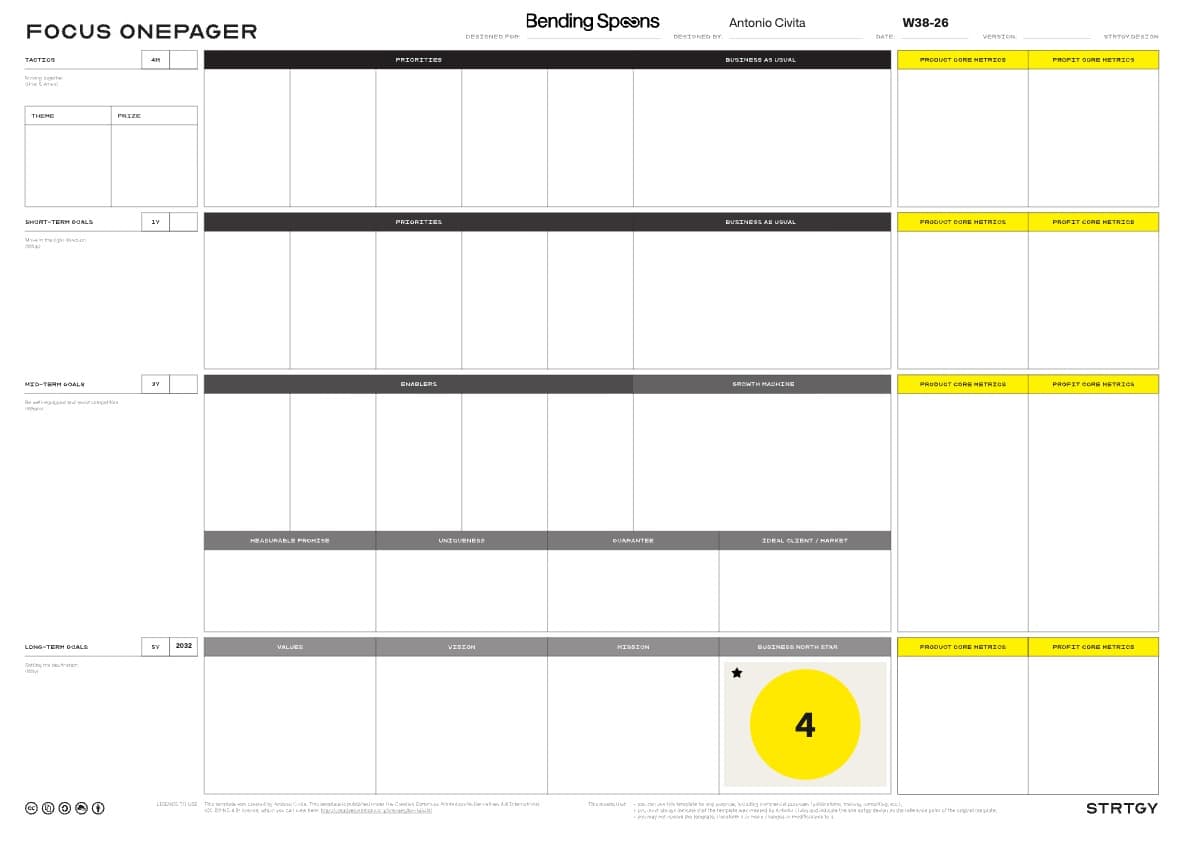
In MAKE PROGRESS®, the North Star Metric is the number you and your team look at to determine whether you’re getting closer to your destination. It reduces uncertainty in decisions and should be updated frequently enough to allow you to take action.
In a multi-product company like Bending Spoons, we choose it at two levels: for the app teams and for the people who build their organization. A single usage metric can’t capture both jobs.
To choose each team’s North Star, we need to be clear about our shared goal. You could invest years in growing revenue and discover too late that you’ve built a company different from the one you wanted. For each team, therefore, the North Star is a crucial number; indeed, it’s THE number by which to measure your contribution to the strategy.
We’ll start with product metrics, with Miro at the center of the recent acquisition deal. Then we’ll move on to the North Star of the organization that manages the portfolio.
How do you find the North Star Metric (NSM) of a product-driven organization?
When a company’s growth depends on its ability to attract, satisfy, and retain users within its product, so long as to recover its acquisition costs and, moreover, to become an acquisition channel itself, we are talking about a product -led organization .
To quickly and accurately find our metric, the simplest way is to ask ourselves what would tell us whether the product is being used and, more importantly, whether its use is increasing over time? How can we measure this in a way that connects to business results, especially financial ones?
Miro is a wonderful example. Those who use it do so to gather research, decide what to include in a roadmap, design a process, or discuss ideas with colleagues during a workshop. The core of the product is the interactive whiteboard on which these people and agents can work together.
Here the question arises naturally, before our eyes. We should ask ourselves:
How much time do Miro users spend working creatively on the shared whiteboard?
I’ll walk you through the reasoning using our framework to connect this answer to its actionability—that is, its ability to influence it by linking it to business results.
As you read, try to find parallels in your own business, so you can turn this case study into a process of thinking about your strategy.
We find breadth, depth and frequency
“Total time active on boards during the week” can be a good metric to nominate as a North Star.
By definition, North Star is not an actionable metric; rather, in terms of turnover, it is a lagging metric, meaning it moves as evidence of work already done and not as evidence of the work itself.
To make it truly practical we need to break it down into the three dimensions used in the MAKE PROGRESS® method:
- Breadth: How many people work on the boards.
- Depth: How much time they spend on average in each session.
- Frequency: How often they return to work on it during the week.
Utenti attivi nella settimana
× durata media di una sessione di lavoro sulle board
× sessioni medie per utente nella settimana
= tempo totale di lavoro attivo sulle board nella settimana
Let’s take an example. One hundred people work on the boards for thirty minutes per session and return four times a week.
100 × 30 × 4 = 12,000 minutes, or 200 hours of work.
With two hundred people, for the same duration and frequency, we reach four hundred hours.
200 × 30 × 4 = 24,000 minutes, or 400 hours of work .
If they return five times instead of four, we get to five hundred. Thus, we distinguish product diffusion from frequency of use.
200 × 30 × 5 = 30,000 minutes, or 500 hours of work .
Five colleagues participating in the same workshop for one hour count as five hours of use. The average duration is calculated across all individual sessions in the period, while the frequency is the average number of sessions per user.
A board opened during a lunch break doesn’t add work time. Sharing a board with colleagues during a workshop, however, can be a sign of genuine participation, even without modifying the board, perhaps because features like the timer or voting are being used. Those with data access must recognize these behaviors and avoid adding together overlapping sessions by the same person.
The NSM is such an important number that I’d keep it prominently displayed in the office, in team communications, and on an updated counter. Watching it grow can be exciting for those who work on the product. Because behind those hours are people returning to the boards to design, discuss, and build something together.
Miro’s stickiness
If I find myself opening Miro less and less, sooner or later I’ll ask myself why I’m still paying for it. If I return to the boards every week to prepare projects and make decisions with colleagues, I’ll have a concrete reason to renew my subscription.
It’s called stickiness : the product is so “sticky” that it becomes part of the work routine. People return to Miro because they find content, colleagues, and tools to move their projects forward.
This is true for Miro and any other digital product. It’s something you should always ask yourself: How can I make sure my product sticks with users?
The team can strengthen this relationship by connecting Miro to other work tools. With AI connectors , for example, I can bring material prepared with an assistant to the boards and use it to discuss research or build a roadmap with colleagues. I have one more reason to return to the board.
After the release, the team can check whether people are using the new feature and returning to the boards. In our formula, we might observe more active users or more frequent sessions. Time should be considered in conjunction with the work completed: a shorter session can be a good result if it allows people to perform the same task better.
From use to renewals and growth
In Miro’s paid plans , the price is per member. When invited members become new members with a paid license, the collaboration can result in an increase in purchased seats. If the product remains part of their work, those seats can be renewed for a longer period.
Guests, however, can collaborate for free , according to the plan and permissions available. An invitation, therefore, does not automatically equate to a license being sold.
But a guest who discovers the value of Miro could purchase licenses for their team and invite others, triggering a viral phenomenon.
The connection is this: we improve the product, people use it to get their work done, they come back and engage their colleagues; when that use requires paid seats or capacity, it increases the chance of capturing and retaining revenue.
From star to constellation

If Miro’s board time increases, what have we learned about the efficiency of the entire Bending Spoons team?
We’ve observed product usage and its potential correlation with renewals. But people choose the group’s apps for different purposes. Looking for a North Star with identical usage across the entire portfolio would force us to make experiences comparable that aren’t comparable, resulting in numbers that aren’t useful to individual teams.
Instead, I’d imagine a constellation. Each team must necessarily look at their own product North Star metric, which in this case we’ll call OMTM, one metric that matters , which literally means the only metric that matters to them , and they all must be connected to the Bending Spoons North Star.
The Operating Machine as an internal service
In its quarterly financial statements as of June 30, 2026 , management describes Bending Spoons as a centralized platform with teams dedicated to individual businesses. Decisions on acquisitions, financing, and resources are complemented by work on product, technology, and marketing.
Think about the team managing an app’s subscriptions. They have to collect renewals and recover defaulted payments. If each team builds the necessary system themselves, the same work gets repeated across different products. One team, however, can develop it and make it available to others, who can adopt it without starting from scratch.
In my reconstruction, the core team operates like an internal SaaS provider: it offers software as a service, along with processes and expertise. It’s as if it “sells” the teams the ability to better manage products and increase profitability.
In this constellation, some teams work for end customers, while others build shared capabilities. The team solving the payments problem can thus improve the work of multiple products. Those working on apps can devote more attention to customers.
To measure this work I start from the Mission.
The North Star I would choose for Bending Spoons
In the second episode I formulated the Mission as follows:
We build an Operating Machine capable of acquiring digital companies, improving their products and business models, and increasing their profits, which can then be reinvested in further acquisitions.
How can we determine whether this operating machine is working as expected and is actually improving processes, rather than simply adding bureaucracy and concentrating resources? We need to measure and ask ourselves the next question.
How much profit is left to the group in relation to the people who build and operate the Operating Machine?
Ultimately, investors don’t buy individual apps and probably don’t care about anything else; they care about the return on investment and the operating machine. So the question is more than legitimate.
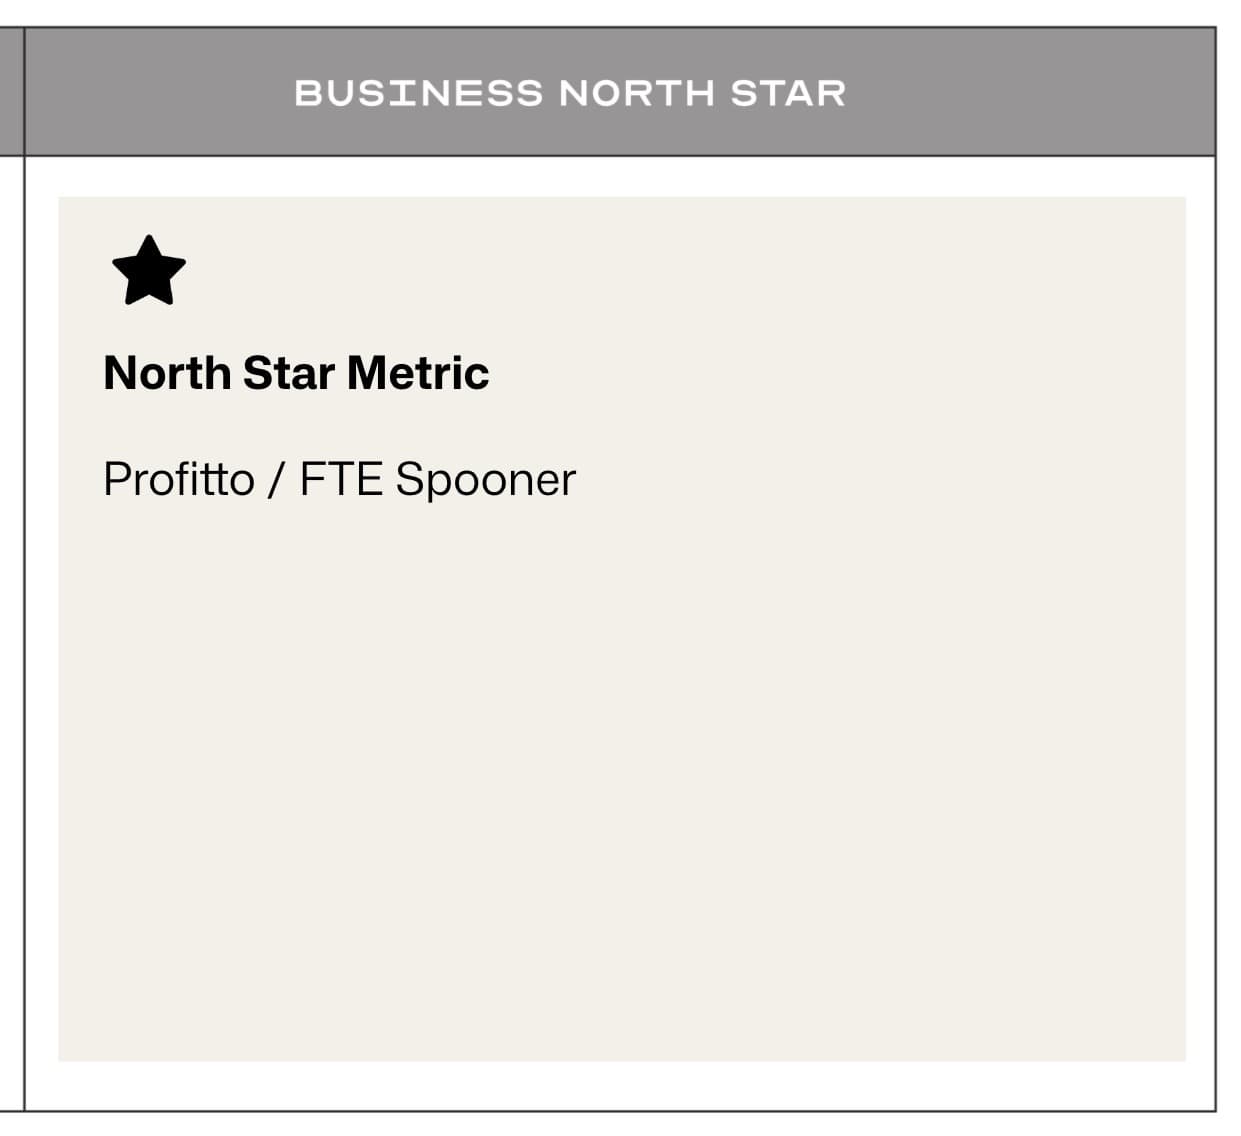
The North Star I propose is Spooner’s operating profit per FTE and I would calculate it that way.
Profitto operativo per FTE Spooner
= profitto operativo del periodo ÷ FTE Spooner medi nello stesso periodo
For those who don’t use these terms every day, operating profit is what’s left of your revenue after paying operating costs, before interest and taxes.
FTE stands for full-time equivalent . Two people working part-time make one FTE. That leaves two people: we’re measuring available work time.
In the listing prospectus , Spooners are distinguished from the group of employees and contractors. They are the people who have passed the selection process to join the core group. The denominator does not contain all the people who contribute to the group’s results.
A person can work hard and contribute to revenue. However, if the organization spends too much to achieve that result, the company is left with little.
It is a measure of the efficiency of the Operating Machine, to which the entire organization contributes, and is not an assessment of individual productivity.
We can also break down the ratio like this:
Profitto operativo per FTE Spooner
= fatturato per FTE Spooner × margine operativo
I choose operating profit to look at product management before financing costs and taxes.
Operating margin is the portion of revenue remaining after operating expenses. The ratio improves if, for the same margin, we manage more revenue for Spooner or if, for the same revenue, we improve the margin.
How to reconstruct the number
The table shows Spooner’s revenue and revenue per FTE. For annual periods, the denominator of the second ratio is the average of the quarter-end figures. We can estimate average FTEs by dividing annual revenue by revenue per Spooner.
For 2025, for example, $1,306.404 million divided by $2.57 million yields approximately 508 average Spooner FTEs. Dividing $277.851 million in operating profit by the estimated value before rounding yields approximately $547,000 per Spooner FTE.
| Exercise | Revenue, millions of dollars | Spooner FTE Revenue, Millions of Dollars | Operating profit, millions of dollars | Estimated Average Spooner FTEs | Spooner Operating Profit per FTE |
|---|---|---|---|---|---|
| 2023 | 387,067 | 1,12 | 84,267 | about 346 | approximately $244,000 |
| 2024 | 671,053 | 1,64 | 127,352 | about 409 | approximately $311,000 |
| 2025 | 1.306,404 | 2,57 | 277,851 | about 508 | approximately $547,000 |
I took revenue and operating profit from the final prospectus filed on July 1, 2026. Average FTEs and profit per FTE are my own calculations. These remain estimates because Spooner’s revenue per FTE is published in rounded form; the resulting average number is not a directly reported count from the company.
Between 2023 and 2025, Spooner’s operating profit increased from approximately $244,000 to approximately $547,000, an increase of approximately 124% .
How to interpret the North Star
A growing profit for Spooner is consistent with the rebuilt Mission: to manage products more profitably and reinvest profits.
The reading I propose also helps to understand the reorganizations.
In the Miro deal release , management describes profound transformations of teams, technology and products to increase the acquired companies’ earnings.
Ferrari and his team therefore buy businesses in which they believe they can perform better than the previous owners. Streamlining teams and concentrating skills helps make work that previously required more resources profitable. Profit, for Spooner, allows us to observe the outcome of this choice, even without knowing whether it’s the metric management actually uses.
How many Spooners does it take to run Miro?
On Miro’s careers page , consulted on October 2, 2026, the team presents itself as a group of over 1,600 people . So it’s natural to ask…
How many Spooners could we employ to run Miro while maintaining at least the profit per person observed in 2025?
For the simulation I start from two numbers:
- Approximately $600 million in ARR for Miro , as indicated by Ferrari in the September 10, 2026, press release on the acquisition agreement . ARR stands for annualized recurring revenue: it describes the pace of revenue, not the revenue already booked for the year.
- Approximately $547,000 in operating profit per FTE Spooner , which we just calculated a few paragraphs ago, based on 2025 data from Bending Spoons.
I didn’t find Miro’s operating profit in the press release, but we can construct three educational scenarios, assuming 600 million in revenues for a full year:
- 10%: A lower margin scenario.
- 21%: the group’s margin in 2025, rounded from 21.27%, obtained by dividing €277.851 million in operating profit by €1,306.404 million in revenue.
- 34%: approximately the margin for the second quarter of 2026, with 240.251 million in operating profit on 704.155 million in revenue, according to quarterly results .
I multiply the projected revenue by each margin. Then I divide the resulting profit by the rounded reference of $547,000, finding the approximate number of additional Spooner FTEs that would be consistent with the 2025 ratio.
The assumed profit must already include all the costs necessary to obtain it, including those of the additional people.
| Assumed operating margin | Assumed additional operating profit | Additional spooners compatible with reference 2025, in average FTEs |
|---|---|---|
| 10% | 60 million dollars | about 110 |
| 21% | 126 million dollars | about 230 |
| 34% | 204 million dollars | about 373 |
Unfortunately, it seems reasonable to consider the risk of further cuts, looking at what happened in previous acquisitions.
This seems like a recurring pattern when looking at Bending Spoons’ history of acquisitions and the restructurings that followed, and the numbers are quite plausible.
- 2026. For Tractive, Eurofound records approximately 160 announced layoffs at the Pasching headquarters. For Vimeo, CineD reports confirmation of the layoffs announced in January , although it should be noted that this number has not been confirmed by the company.
- 2025. For Komoot, Der Standard reports 75% staff cuts following the acquisition in March.
- 2024 and 2023. For WeTransfer, Ferrari announced to Reuters a 75% cut plan . For Evernote, the team announced in July 2023 that it would move most of its operations to Europe and lay off most of its employees in the United States and Chile.
How to check the results of the strategy
With North Star and OMTM, we have the benchmarks to track strategy execution across products and the Operating Machine. We then need to verify whether that work produces useful results for customers and sustainable results for the company.
Measuring strategy by focusing only on revenue can be dangerous. It’s a mistake I often see in implementations: choosing the number to grow before understanding how the organization works. Revenues may increase while margins deteriorate, customers abandon the product, or it may require ever-increasing resources to achieve the same result.
Saying that strategy must produce financial results is like remembering to breathe: it’s a necessary condition. However, we need to understand which mechanisms can be improved to achieve those results and continue to produce them over time .
For this reason, in the yellow lateral columns of the SFO, we place two groups of indicators next to the North Star.
Product Core Metrics: Product Health
Here we look at the relationship with customers: how many people use the product, how many continue to use it, and the average revenue they generate. Active users, retention, and average revenue per user help us determine whether product work is improving that relationship.
Profit Core Metrics: Financial Health
Here we monitor turnover, margins, profits, and cash flow. This allows us to determine whether growth is providing the company with the resources needed to sustain operations and finance future decisions.
Revenue therefore remains visible. But, as we saw with Bending Spoons, its increase isn’t enough to demonstrate that the organization is performing better.
Grounding decisions
These metrics will also be useful in the next episode, when we rebuild the Growth Machine. The concept behind MAKE PROGRESS® is to build an organization capable of achieving the scale of your ambitions.
To do this, we need grounding , that is, connecting strategic hypotheses to observable data: what results we’re starting from, what we want to improve, and what changes we expect from our decisions. This way, we can verify the connections between the work done and the results.
Apply these concepts to your strategy
Think about the number you and your team look at when deciding where to invest time, talent, and money. If it increased, could you explain which part of the strategy is working best?
Review your Vision and Mission and compare that number with the three-question checklist I use in the “Where Are the Numbers?” chapter of MAKE PROGRESS®. If you haven’t yet chosen a North Star, use this checklist to evaluate an initial proposal.
If you manage multiple products, answer for each one first. Then consider the organization’s work: what capabilities does it offer the teams, and what financial results does it improve?
1. Does it measure customer value?
Ask yourself what observable relationship this represents. For Miro, we measure the time spent on the boards and observe what people are able to accomplish and whether they return to them.
The number of registrations can increase without anyone using the product. Look for an activity that helps you recognize the usefulness of the product.
2. Is it aligned with the Vision?
If that number increased over the next three years, would you be moving closer to the future you described? Revisit the target before deciding what to ask the team to improve.
For Bending Spoons, I linked Spooner’s profit to the work required to build the Operating Machine and reinvest the profits. The same applies to your Mission: explain how the number you choose represents progress toward what you want to build.
3. Is it related to turnover?
Describe how that relationship can generate revenue. For Miro, we linked stickiness to subscription renewals and the spread of paid seating among colleagues. In your company, what behavior makes the customer more likely to purchase, return, or expand the relationship? Verify this with the data, distinguishing between free usage and revenue.
North Star doesn’t need to include revenue in its formula. It needs to be able to explain the connection and verify it.
Compare the answers with your team and define what to measure, over what period, and with what units. For Miro, people × minutes per session × sessions per person gives minutes of usage. For profit per unit, clarify which unit you choose and why.
Return to the number you started with. At the next meeting, share how it went and reflect on the consequences: what will you continue to do, what will you change, and based on what information?
Indicate where you’ll find the data and how you’ll keep it updated. Before assigning additional resources, try explaining together which activity you want to improve and how you’ll find out. If the answers are different, you’ve identified a strategic choice that needs clarification.
The complete reasoning is available in the MAKE PROGRESS® book ; the toolkit lets you work on the numbers and connect them to your SFO.
In the next episode
In the fourth episode, I’ll reconstruct Bending Spoons’ Growth Machine to understand how Ferrari and his team try to connect the effects of their decisions and replicate growth after each acquisition.
ALWAYS MAKE PROGRESS ●↑
Antonio Civita , founder of STRTGY and author of MAKE PROGRESS® with OKRs . I work with entrepreneurs and teams to connect strategy and execution. To contact me, you can reply to a STRTGY newsletter.