“Our Playbook has remained essentially the same since 2013.”
Luca Ferrari , CEO of Bending Spoons, introductory letter to the listing prospectus .
●↑
From a company like Bending Spoons, you might expect a very complicated strategy…
Yet we can reconstruct its growth with a handful of mutually reinforcing strategic effects. And by the time you’ve finished reading this strategic note, you can do the same for your company.
You see, you can grow even with a flawed strategy if you can seize opportunities promptly. If the market pushes you, you can achieve enviable results even when your fundamental decisions don’t hold up, or even when there’s no basis at all. But when conditions change, you need to know what to adjust.
If you can’t repeat what worked, you’re still surfing on luck.
But with a simple model to understand and run repeatedly, you can identify where work is stalling and fix it. You can evolve it and increase the team’s accuracy.
What outcomes should you focus your company’s scarcest resources on? Are you alone in this decision, or can you empower the team to finally become autonomous? Teams in rapidly growing companies must learn to do a few things incredibly well, avoiding becoming scattered across dozens of unrelated tasks. With the Growth Machine you can make those results visible and bring your business strategy into your daily work.
This is episode 4 of 6 in the series where I reconstruct Bending Spoons’ growth strategy using MAKE PROGRESS®. In each episode, we fill out a block of the Strategy Focus Onepager (SFO), the “page” where we gather the key strategic decisions, so you can apply the same reasoning to your own business.
You can apply this method even if you only sell one product or service. Keep in mind a project you’re considering. At the end of this strategic note, I’ve provided you with the recipe for a fifty-minute workshop: you’ll draw an initial map of your growth and understand where that project fits in.
As always, you can use the AI buttons in this article to bring this note into your assistant and have it guide you through the workshop. Add the context of your company and the projects you want to work on.
Series Index
- The Bending Spoons Operating Model : What kind of company are we building?
- Values, Vision, and Mission : How to orient your team.
- The North Star Metric by Bending Spoons : How to Measure Progress.
- The Growth Machine: What Effects Make Growth Repeatable? ← You are here.
- The enablers: what capabilities are needed to execute the strategy.
- Priorities: what to focus your work on.
What is the Growth Machine and how does it make growth repeatable?
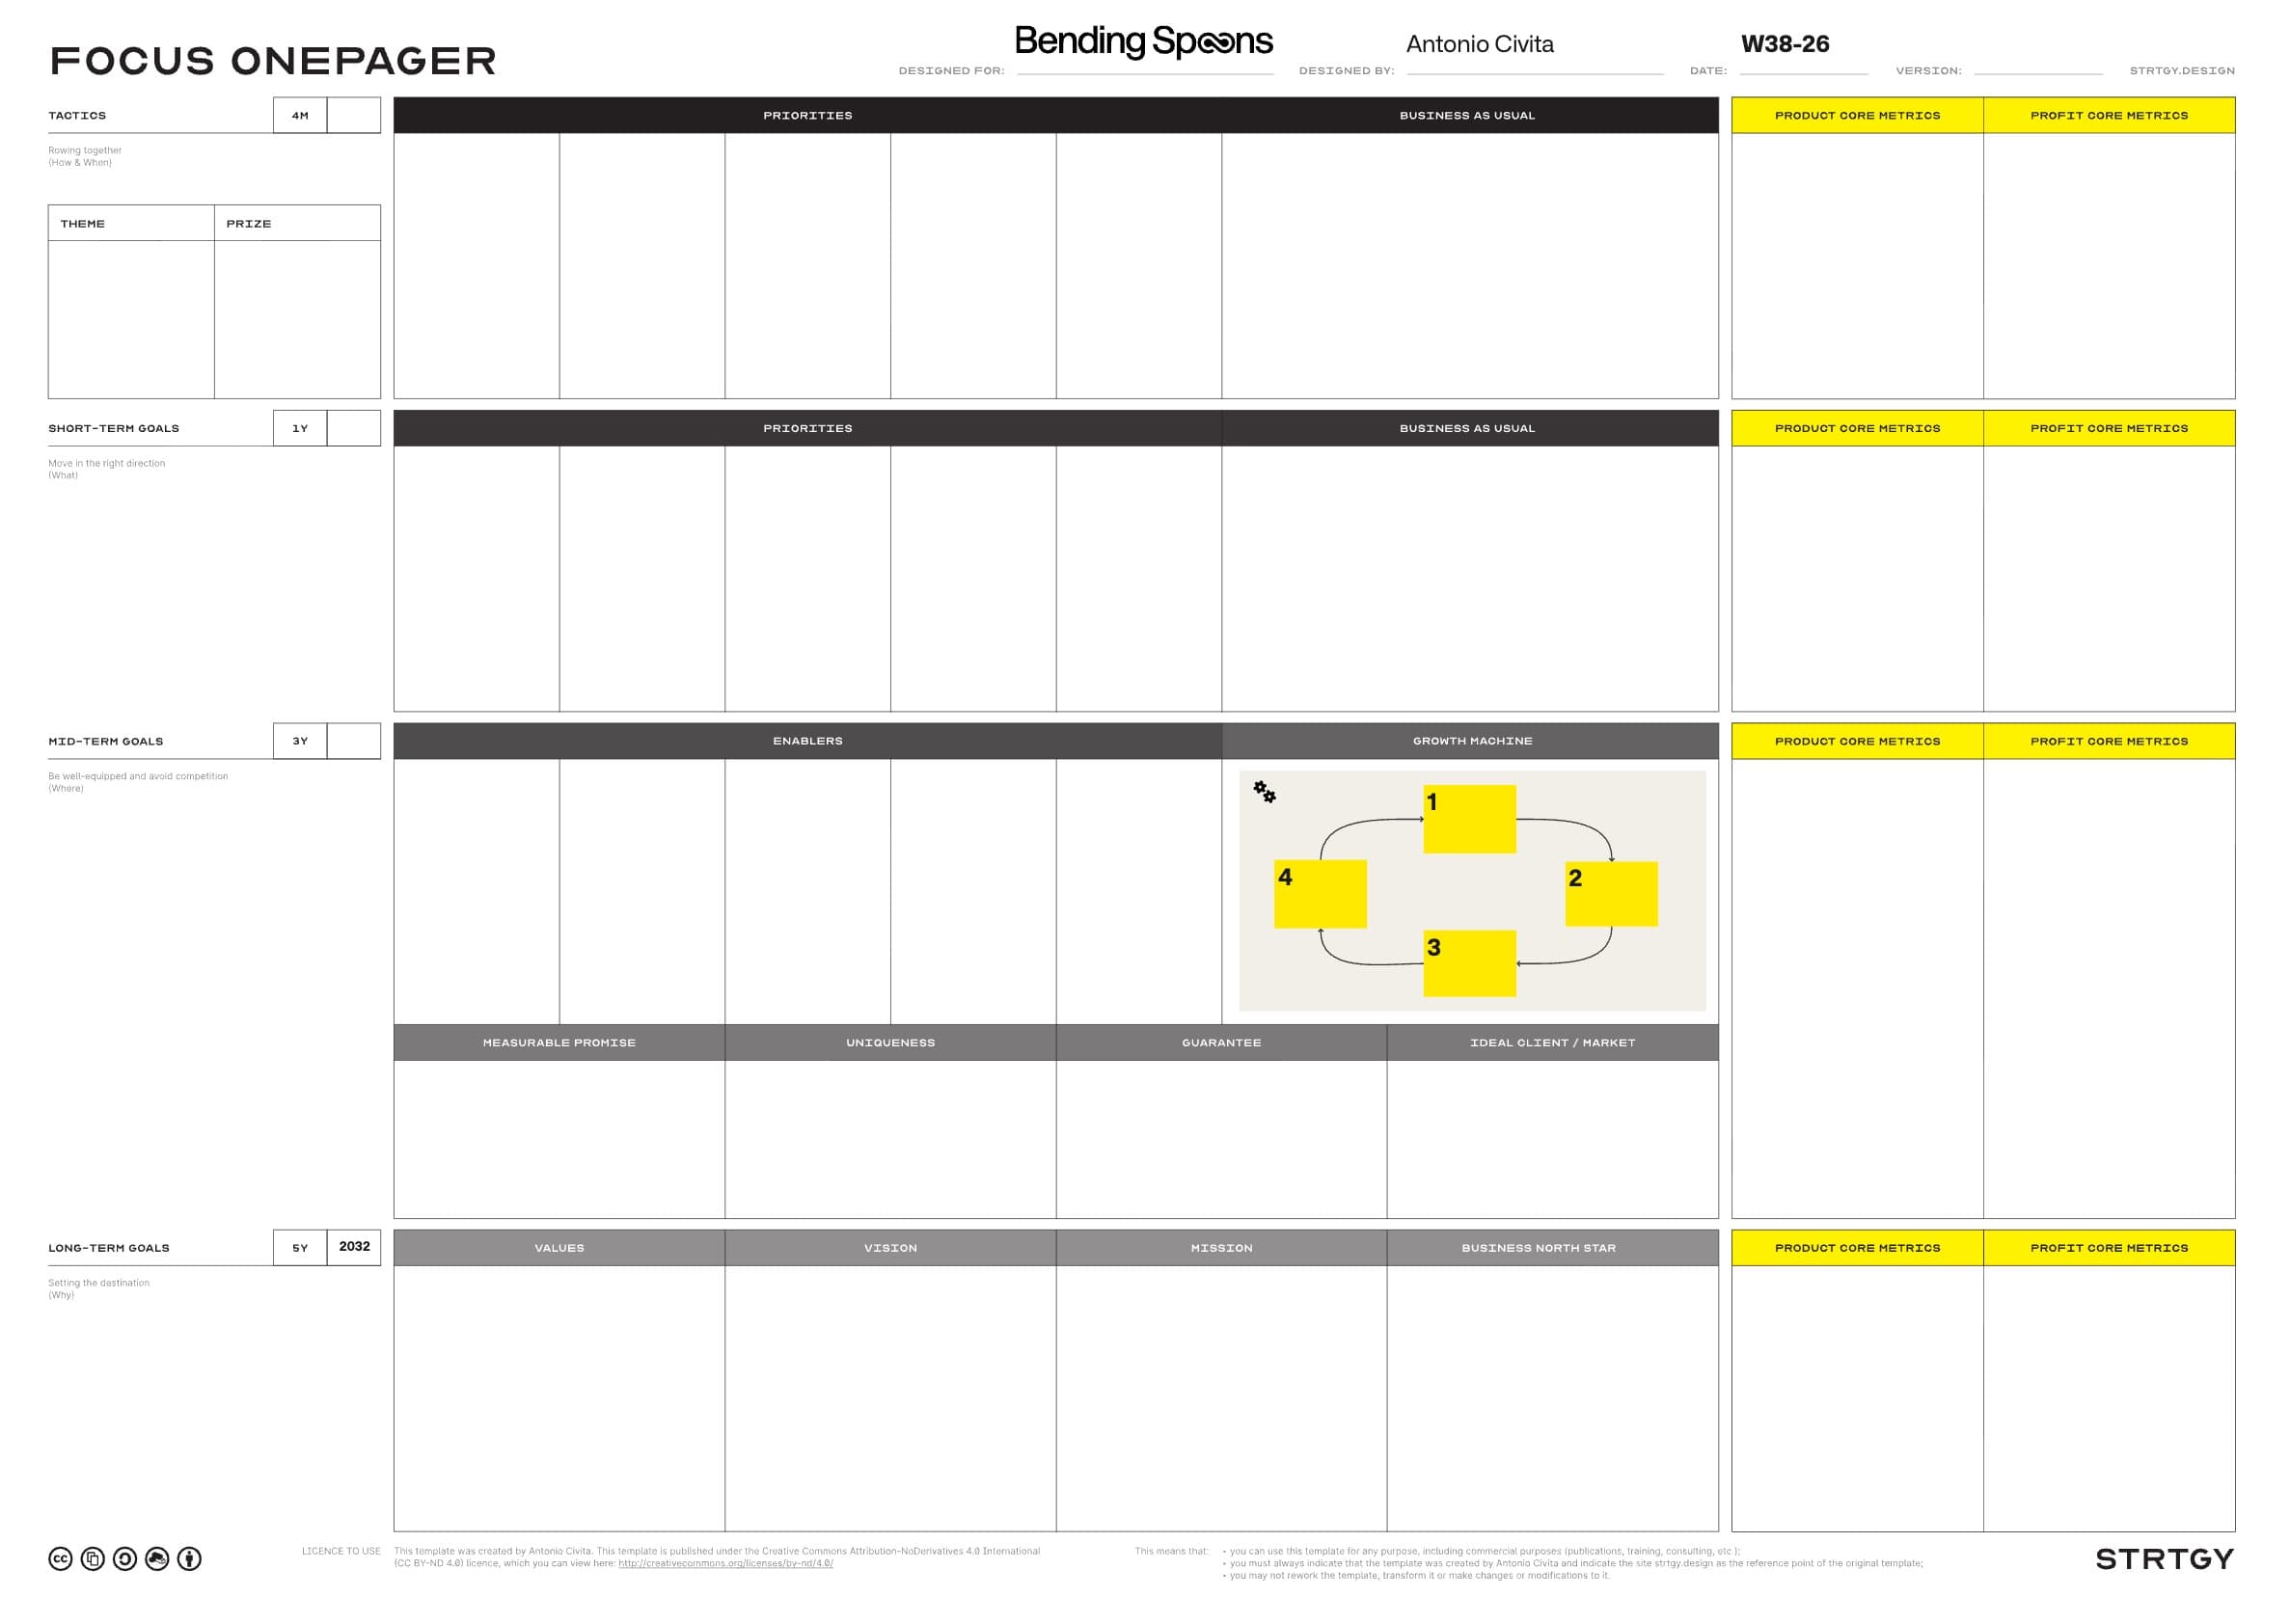
In MAKE PROGRESS®, the Growth Machine is the repeatable business growth mechanism upon which the organization’s persistent model is based. We represent it as a cycle of strategic effects, i.e., results that teams must be able to consistently produce.
The persistent model is the work a company must do to achieve its mission. If you want to help customers complete a job better and faster, you’ll continually understand their problems and improve your service. You’ll be able to change campaigns, projects, and technologies while keeping those results as a benchmark.
In the gears, we write effects like “More returning customers.” Teams then choose the activities to achieve them. Each link is read by adding “has an inevitable positive effect on.” To design it, we need to explain how one outcome contributes to the next, identify the conditions that make that step possible, and verify it in the work.
The decisive step is the one that closes the cycle. The last result must strengthen the ability to produce the first. Thus, each time the team achieves a strategic effect, it can also increase its capacity to tackle the next round. The skills, information, and resources that remain available allow the impact of the work to be amplified over time.
To design repeatable growth, we must identify the effects we know how to achieve, connect them, and improve the way we produce them over time. From a successful project, we can learn what to repeat and under what conditions. With the funnel, we follow the steps from first contact to purchase; with the Growth Machine, we also explore how the value achieved allows us to start over.
The same reasoning applies to the entire group and to each product. It’s the fractal structure of the Growth Machine: each team can recognize its own contribution and connect it to the results of others. This allows you to make explicit the rules people apply in their work, compare them, and improve them together.
From North Star to Growth Machine
In the third episode, we chose the North Star, the number used to monitor the organization’s progress. With the Growth Machine, we connect that progress to the work of the teams. Before funding the project you have in mind, you can indicate which impact you want to improve and how you will notice it.
A project may seem interesting and yet not strengthen any of the connections you’ve drawn. Before adding it, ask yourself if something is missing from the model or if you’re chasing an opportunity that’s distracting you from your priority work. In strategic planning, you can use this map to choose which projects to allocate time, talent, and money to.
How the Bending Spoons Business Model Works
Bending Spoons acquires and manages digital products that have already found a market. Its business model involves teams working to improve them and generate resources to reinvest in the group’s capabilities and new acquisitions. This is the mechanism described by Luca Ferrari in his letter to investors .
You should know that Ferrari and his partners started after the failure of Evertale, their first product. In the prospectus , Ferrari recalls a team of five people and about $40,000 with which to start Bending Spoons.
Since 2013, the Playbook has remained essentially the same: acquire, transform, and improve, then reinvest. The Platform comprises the people, proprietary technologies, and shared data with which the teams execute it. Together, they form the Operating Machine, the group’s operating system.
The Four Gears of the Bending Spoons Growth Machine
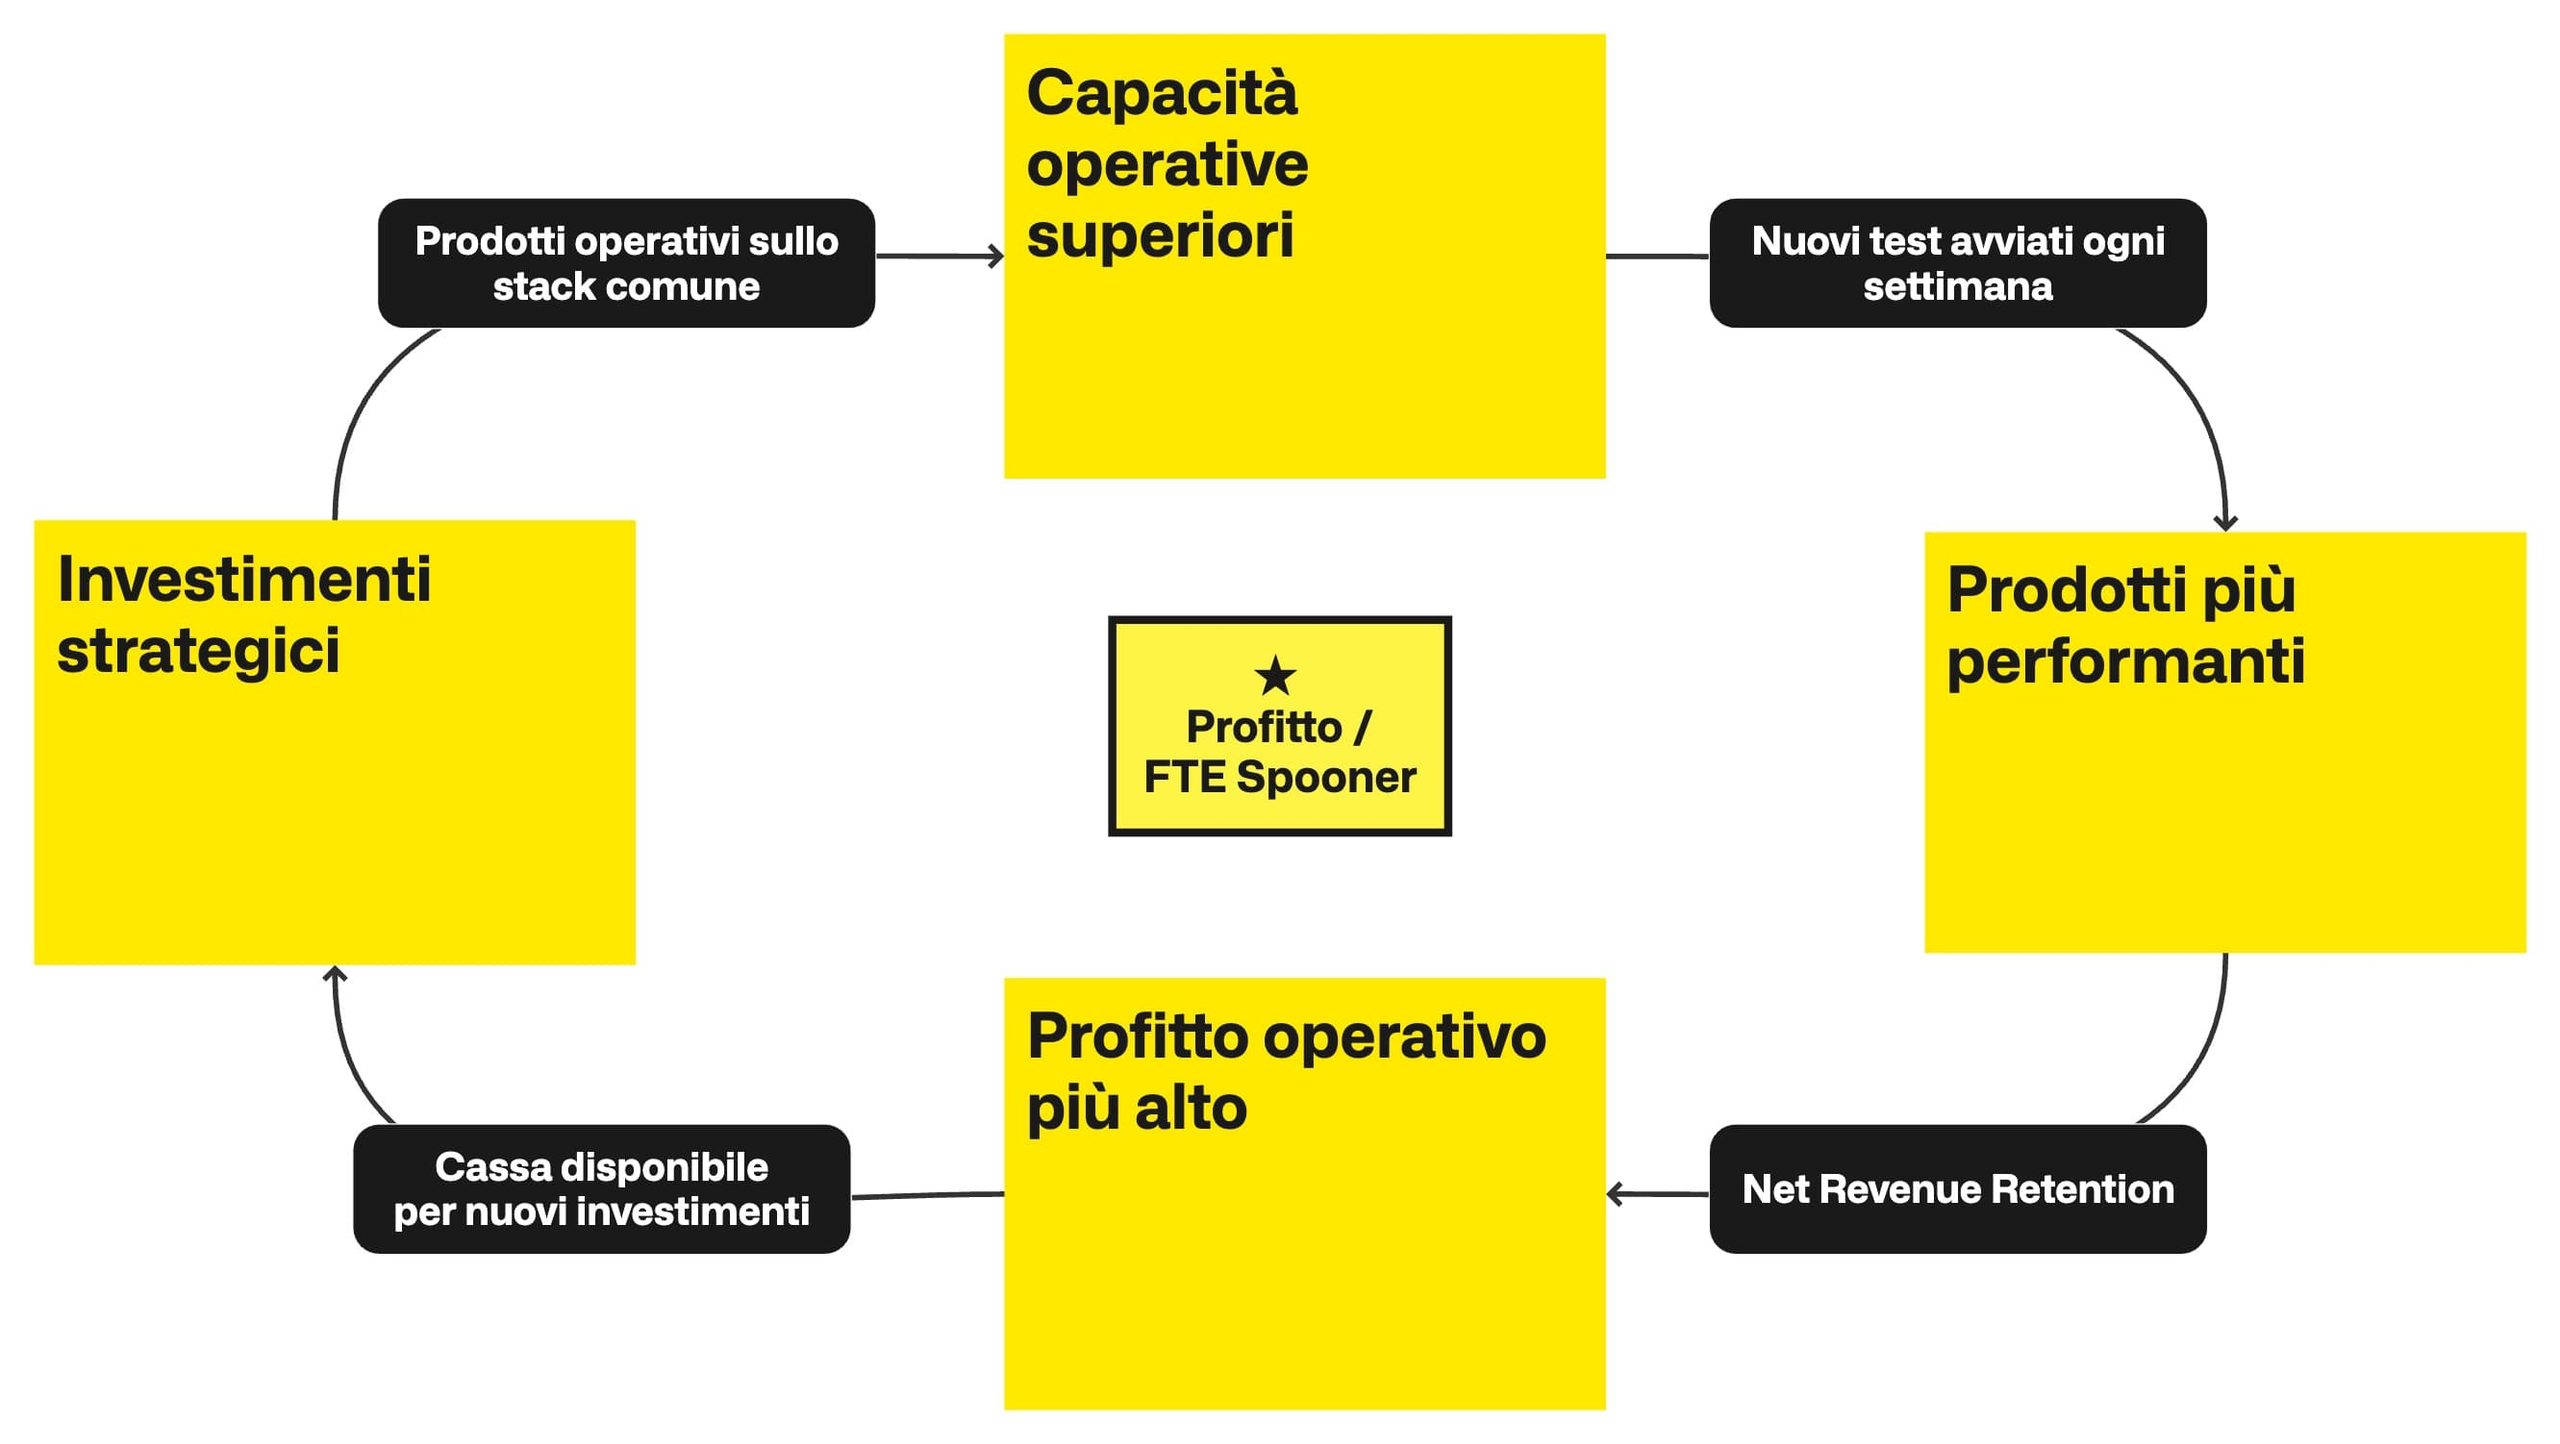
In my book, I described the growth machines of Amazon, Uber, and my clients. For Bending Spoons, I reconstructed this cycle starting from the IPO prospectus and the second-quarter 2026 results :
→ 1. Capacità operative superiori
→ 2. Prodotti più performanti
→ 3. Profitto operativo più alto
→ 4. Investimenti strategici
In the illustrations, distinguish the effects within the gears from the KPIs , the key performance indicators on the arrows. We use them to assess the conditions for the next outcome: some measure leading signals, others, like the NRR, the economic stability already observed.
At the core remains the group’s North Star, as proposed in the series: operating profit / average Spooner FTEs , over the same period. FTEs stand for full-time equivalents; Spooners are the core group, distinct from all those working on the products. The cycle reconstruction and the choice of KPIs are mine. The NRR is published by the group; the other three indicators are suggestions to verify the connections.
For each gear we will see what happens, how value is transferred and how it is measured.
1. Superior operational capabilities
What’s happening
Teams are able to continuously test ideas. They use shared expertise, data, and tools to prepare experiments and analyze their results, building on each other’s work rather than rebuilding the method each time.
Sean Ellis describes this rhythm in his talk on growth culture : The team reviews the results and chooses new ideas to test each week.
How value is transferred
Operational capabilities allow you to launch product experiments. If the team obtains reliable results and makes decisions, they can discard harmful changes and implement beneficial ones. This contributes to the second gear: Higher-Performance Products . If the results are not analyzed and subsequent decisions are made, more tests add work without improving the product.
How is it measured?
New tests started this week. We’re talking about product or growth experiments. I count each experiment only once, when the actual exposure envisaged by the test begins, with a hypothesis, a manager, and measures already defined. The variants belong to the same experiment. Listed ideas and automated software tests are left out.
The number measures starts, not tests started or completed. I would also read it by product, to distinguish a team acceleration from a total increase due to an acquisition.
2. Higher-performance products
What’s happening
Users are more likely to get the results they’re looking for and have a reason to continue using the product. Teams can improve utility, reliability, or ease of use: the benefit must be recognizable in people’s experience.
How value is transferred
In subscription products, this benefit can translate into continuity of use and payments. In the prospectus , management describes contracts that typically renew automatically, with terms ranging from one week to several years. We are therefore interested in understanding how much economic value we retain from the existing customer base.
To contribute to the third gear, Higher Operating Profit , additional revenue must exceed additional costs. If retaining a customer requires too much effort to provide the service, we can retain more revenue without earning more profit.
How is it measured?
NRR (%). Net Revenue Retention compares subscription revenue generated from an existing customer base to that of the previous corresponding period. Bending Spoons reports a 94% NRR for Q1 2026. According to the company’s definition , the calculation for that quarter is:
Ricavi da abbonamenti nel Q1 2026
dei clienti acquisiti prima della fine del Q1 2025
÷ ricavi da abbonamenti nel Q1 2025
× 100
Let’s take an example with your SaaS. In the first quarter of last year, your existing customers generated €10,000 in subscriptions. In the same quarter this year, that group of customers generated €9,400. The NRR is 94%.
That amount depends on who stops paying, who switches plans, and pricing. It doesn’t mean you’ve lost 6% of your subscribers.
It’s a somewhat cryptic metric, but very interesting. I’ve talked about it here, where I encourage you to use it instead of NPS , and here, where I explain why it was crucial in Figma’s stellar rating .
Bending Spoons’ calculations also include users who had previously interacted with a product but only started paying later. The comparison involves the same companies in the two periods: for those recently acquired, pre-acquisition data is also included, estimated where necessary.
To interpret it, I would look at the churn of paid subscriptions , i.e., how many actually cease to be active, and the share of recurring revenue with renewal deactivated . The latter is the portion of the current customer base that will not renew at the next expiration date. It’s an early warning signal: a subscription with renewal deactivated can remain active until its expiration date, and the customer can reactivate the renewal.
NRR is a historical measure I would use to assess future economic stability, not a guaranteed profit forecast. To interpret it correctly, we compare consistent products and periods and observe prices, costs, and customer benefits.
3. Higher operating profit
What’s happening
Product management leaves the company with more resources after operating costs, before interest and taxes. To invest these resources, however, management must have available cash, after considering existing commitments.
How value is transferred
Cash free from operating and financial commitments allows management to finance the fourth gear, Strategic Investments . The decision depends on the opportunities: if they aren’t suitable, management can conserve cash or reduce debt. The KPI anticipates the possibility of investing, without requiring full spending.
How is it measured?
Cash available for new investments ($) , after operating and financial commitments. I would calculate how much of the internally generated cash remains after covering the necessary investments, debt service, other commitments, and the minimum liquidity requirement. Each item is counted only once.
I would keep new loans and member contributions separate. They can finance growth, but in this connection, we want to understand what resources the organization has generated through its own management.
4. Strategic investments
What’s happening
Teams gain new resources through investments in people, technology, or acquisitions. Training, AI, and shared knowledge support their work. At Bending Spoons, we also focus on the common stack , the set of tools and infrastructure that can be used across different products.
For example, the group’s website features Juno for payment management and Pico for data collection. These are examples of shareable features; internal data is needed to understand how many products they’re actually used on.
How value is transferred
If the tool exists but teams continue to work on legacy systems, common capabilities remain unused. When products operate on the common stack, people can apply the same data and tools to a broader portfolio.
We thus return to Higher Operational Capabilities . In the first gear, we’ll see if the teams are able to use those resources to experiment more effectively: skills and method are still needed, in addition to technical integration.
How is it measured?
Products fully operational on the common stack (%). I calculate the ratio on all active products in the portfolio:
Prodotti pienamente integrati
÷ prodotti attivi nel portafoglio
× 100
I would consider a product integrated when it uses all the common components required for its type in operation. The scope must be defined beforehand: 100% concerns those functions, not every line of code. The team must use them in ordinary operations, have the necessary data, and have replaced the previous systems for the migrated functions.
I would also show the number of integrated products. An acquisition can increase the denominator and decrease the percentage as the integration of other products progresses.
Who inspired Bending Spoons?
Jim Barksdale, former CEO of Netscape, said: “Gentlemen, I only know two ways to make money: bundling and unbundling.” HBR .
With bundling, you combine multiple products or services into one offering; with unbundling, you separate a portion of them and offer it on its own.
Barksdale applied this reasoning not only to companies bundling products for the same customers, but also to the aggregation of multiple companies with shared capabilities to reach different customers: bringing them together when they can create more value together, separating them when they can work better alone.
To read Bending Spoons, we can shift our focus to what lies behind the products. The clustering involves skills, technologies, and data that teams can reuse. It’s in this organizational parallel that the Growth Machine describes how those capabilities contribute to growth, and this explains why you should seriously consider defining and implementing it with great discipline in your organization as well.
The inspiration for adopting this model is stated by the founders themselves in the introductory letter to the prospectus , when they cite Broadcom, Danaher and TransDigm among the companies studied to understand how effective operational management can improve the results of acquisitions.
Danaher brings together more than fifteen companies in the biotechnology, life sciences, and diagnostics sectors. The teams apply a common system of continuous improvement, the Danaher Business System (DBS) .
In the DBS presentation, the group leaders describe a cycle that we can summarize as follows:
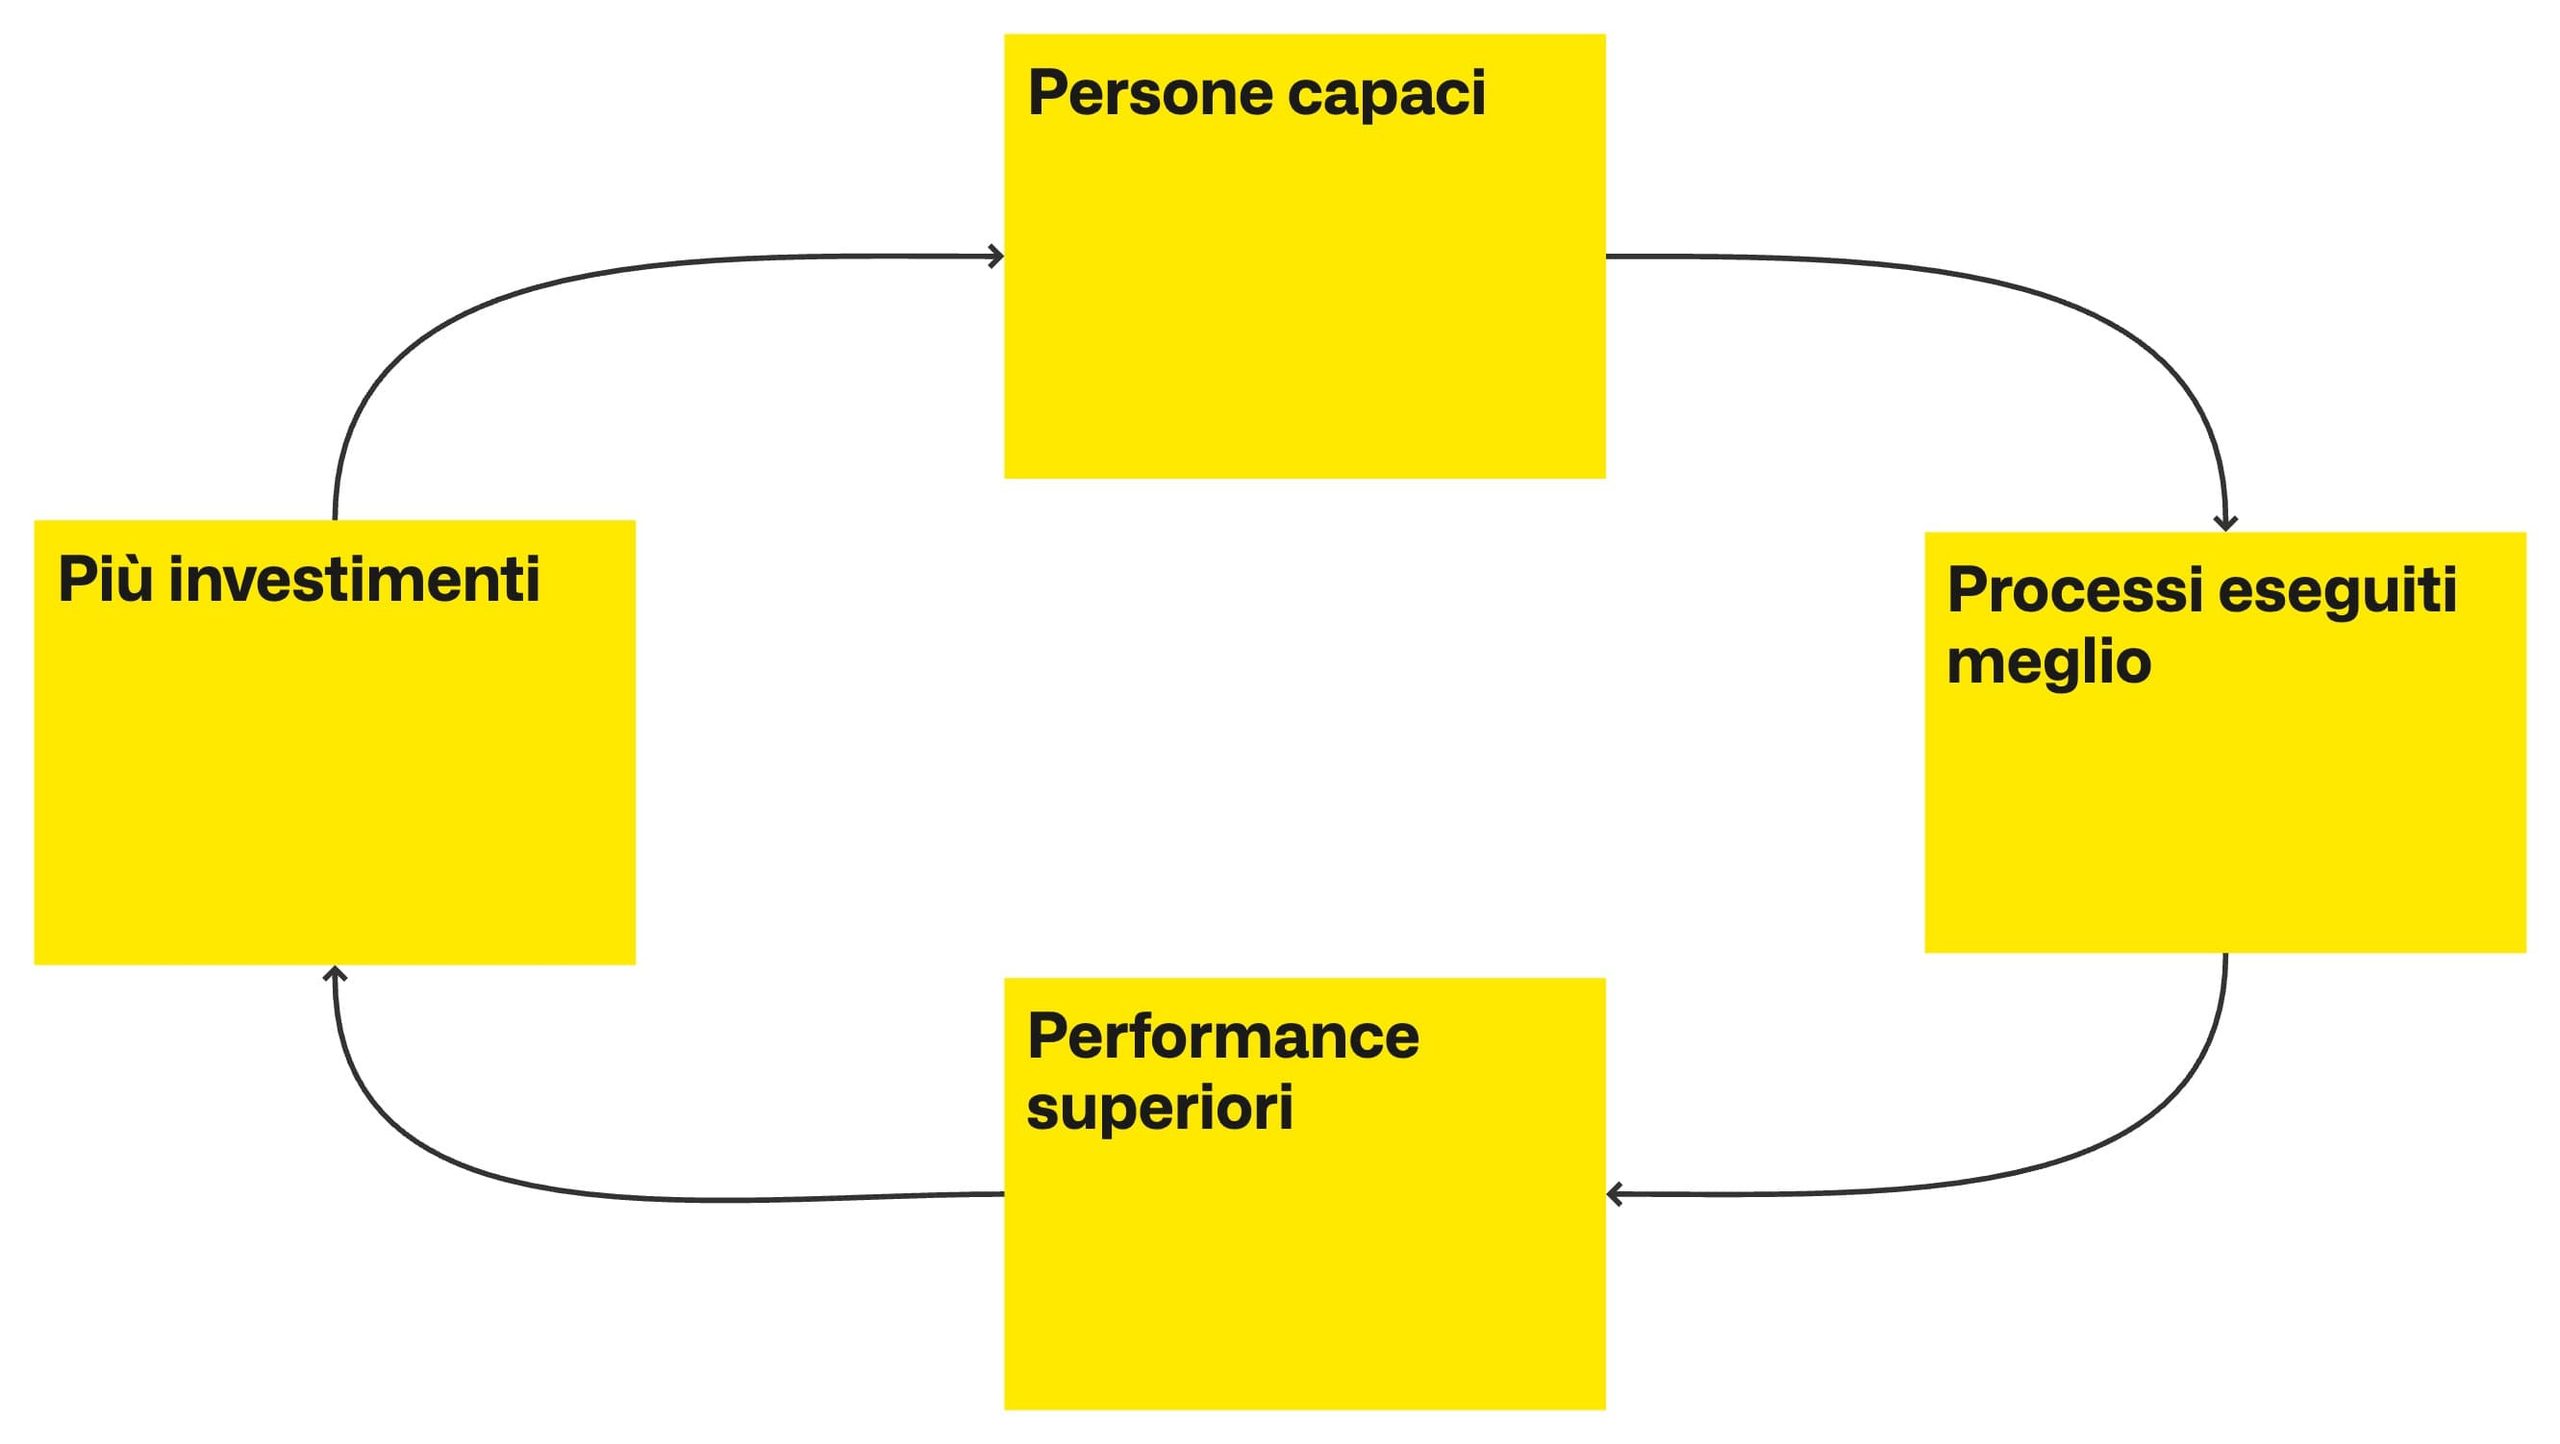
→ 1 Persone capaci
→ 2 Processi eseguiti meglio
→ 3 Performance superiori
→ 4 Più investimenti (che riescono ad attrarre altre persone capaci, 1)
The cycle you just saw recurs in the most effective Growth Machines I’ve analyzed recently. At Danaher, people from individual companies apply a common method within a decentralized operating structure .
It’s a way to put a strategic principle into practice: centralized decisions, decentralized execution . Those who lead the company choose the direction, priorities, and expected results. Teams decide how to achieve them, using what they learn on the job to improve processes.
Larry Culp, former CEO of Danaher, shared a useful detail in an interview published in 2021. Company presidents participated in improvement weeks called “President Kaizens” and worked directly on processes with their teams. Even company managers had to know how to apply the method.
With MAKE PROGRESS®, we can interpret these models and build our own company’s. This is why I consider it an operational meta-model. The cycle you just saw is also a template for your Growth Machine. You can adapt it to your company by starting from people’s capabilities, clarifying what results they produce and how those results allow you to strengthen the initial capabilities.
Where competitive advantage is built
Anyone can copy the framework we’ve just reconstructed. To make it work, however, they must build expertise, gather information, and learn from the decisions teams have made over time.
In the prospectus , Ferrari identifies the Platform—that is, people, technologies, and data—as the main source of the group’s competitive advantage. Accumulated work matters even when the model is understandable to everyone.
In your company, each iteration can help your team better read signals, avoid a previous mistake, and improve the accuracy of subsequent work. When you share what you learn and others can use it, those starting from scratch need to recapture that history, too.
This is the gap you can build over your competition: a simple model, expertly executed, and improved through repetition. The better you get at making it work, the harder it is to catch up with you by simply copying the design.
To understand how to grow your business, we revisit projects that have already worked. We look for effects you can produce again and that are worth improving on.
Apply these concepts to your strategy
I’m taking the five steps from the Growth Machine Workshop section from the MAKE PROGRESS® book with OKRs , in a simplified form. Set aside fifty minutes with the people who lead the company and the teams, prepare physical or digital post-its, and choose who will facilitate the discussion.
Start with the projects that led to your current results. You’ll draw an initial map of the emerging strategy, that is, how you’ve worked so far. Data verification will continue after the workshop.
1. Collect successful projects. 10 minutes, individually.
Think back over the last twelve, twenty-four, or thirty-six months and list at least five projects that contributed to your growth. Whenever possible, choose projects that you’ve replicated at least twice: this will help you distinguish repeatable results from one-off successes.
2. Reconstruct how you achieved those results. 15 minutes, individually.
For each project, sequence the events that contributed to its success. If it’s a client, you might start with the first contact and move on to the quote, the design, the delivery, and what happened next. Write one step per post-it.
3. Look for recurring effects. 10 minutes, together
Arrange the sequences one below the other and place those related to the same projects side by side. Read them aloud and look for repetitions. For each occurrence, write the result obtained thanks to those activities on a different colored post-it.
For example, if the client has assigned you a new assignment after the initial delivery on multiple projects, you might write, “More returning clients.” You’ve described the repeatable effect, which people from different teams can contribute to.
4. Choose your gears. 5 minutes, together
Select four to six strategic effects, combining similar ones. Preserve the results the organization is capable of producing consistently. Eliminate sporadic initiatives and phenomena that depend on circumstances beyond your control.
5. Close the loop and compare it with real work. 10 minutes, together.
Arrange the Post-its in a circle and read each connection, adding “has a positive effect on.” Also check the transition from the last gear to the first. If you can’t explain a relationship, go back to the collected effects and correct the drawing, without forcing the connection.
Review your initial projects: can you relate them to the sequence of results you described? Do the same with ongoing projects and those you’re about to launch. Ultimately, all leadership must share the same vision of how the company operates.
Return to the project you initially chose. With your team, identify which mechanism needs improvement, which signal will predict the next outcome, and when you’ll observe it. Decide who will collect the data. This way, you can choose which activities are truly worth your time, talent, and money, and focus on a few outcomes that you can continually improve upon.
If you’d like to work on your company’s Growth Machine, contact me by replying to one of the STRTGY newsletters. Tell me what result you want to make repeatable.
In the next episode
If you’ve read this far, you’ll have realized that most of the strategic information is already there before your eyes. You won’t need much more to identify your priorities for the next 12 months and the next four months. This will be the point where strategy meets execution.
This is precisely what we’ll be working on next week: how to connect what seems like theory, but is actually the most important work of every business leader, with everyday activities. We’ll separate business as usual from innovation, trying to build a guide to prioritize everyone’s activities in the company, without babysitting.
You’ll see that it will be so simple that you’ll regret not having done it sooner.
ALWAYS MAKE PROGRESS ●↑
Antonio Civita, founder of STRTGY and author of MAKE PROGRESS® with OKRs . I work with entrepreneurs and teams to connect strategy and execution. To contact me, you can reply to a STRTGY newsletter.